- Solutions

Classification & strategy
Align your inventory strategy with your business objectives

Management by exception
Plan efficiently by focusing on impactful parts

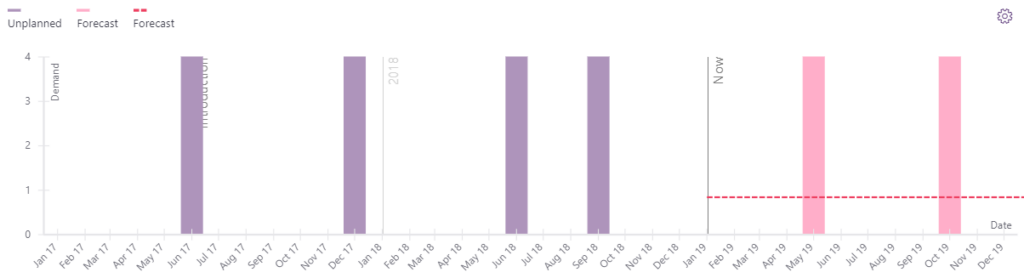
Demand forecasting
Predict your future demand

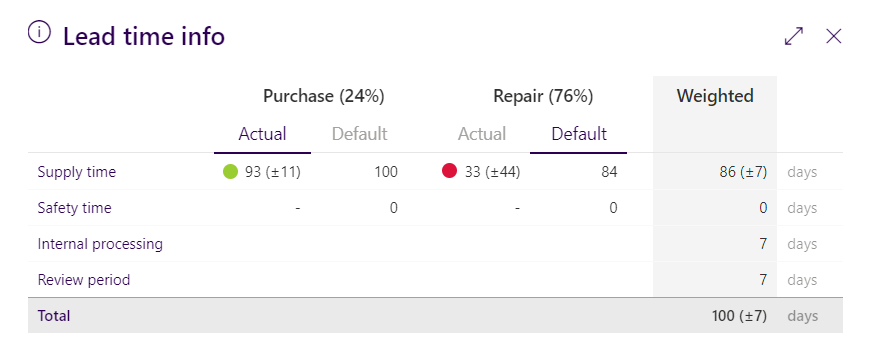
Supply management
Deal with unpredictable lead times and supply constraints

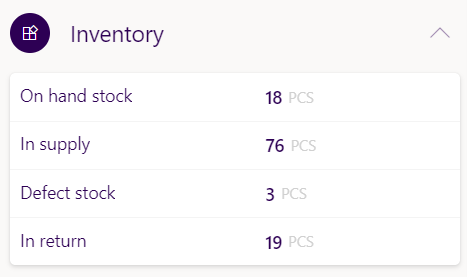
Inventory control
Achieve your client's SLA through sensible stock holding

Business intelligence
Get actionable insights to create business impact

Network optimization
Optimize your network of stocks with Multi-Echelon Optimization (MEO)
- About us

Our promise
We deliver an advanced made simple solution for your business needs

Our team
Get to meet our passionate Lanza team

Join us
Watch out for our vacancies